What Is AI-Powered Onchain Analytics?
AI-powered onchain analytics uses machine learning to process blockchain transaction data and predict market movements. Onchain metrics measure real economic activity:
- Wallet movements
- Exchange flows
- Transaction volumes
- Smart contract interactions
- Liquidity changes
AI identifies patterns in these metrics and correlates them with price movements.
How It Differs from Traditional Technical Analysis
Technical analysis uses price charts and volume. Onchain analysis uses fundamental blockchain data. AI onchain analytics combines both by correlating behavior with price movements and builds predictive models.
Data Sources for Onchain Intelligence
Onchain data comes from:
- Blockchain nodes (full transaction records)
- Block explorers (Etherscan, Solscan)
- Analytics platforms (Glassnode, IntoTheBlock, Nansen)
Each source offers different data perspectives.
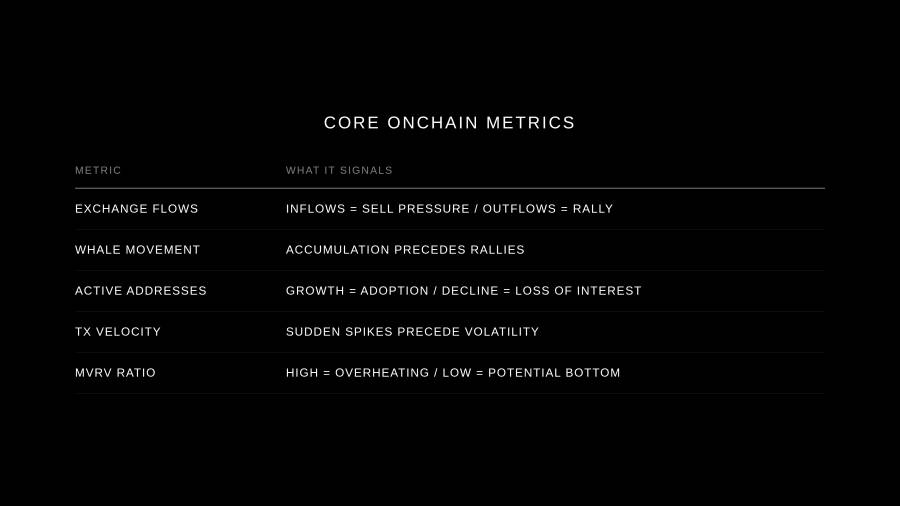
Core Onchain Metrics AI Systems Track
AI systems monitor dozens of metrics, but a few core ones drive most predictive signals.
Exchange Flow Analysis
How much crypto is moving into and out of exchanges:
- Large inflows often precede price drops
- Large outflows precede rallies
- Stablecoin inflows signal buying readiness
AI systems track exchange flows in real time and flag anomalies.
Whale Wallet Movement
The top 1% of wallets hold 90% of most tokens. When whales move, markets react. AI systems:
- Identify whale wallets
- Track transactions
- Predict price impact
- Flag accumulation patterns
Whale buying accumulation often precedes rallies.
Active Address Growth
Growing numbers of active addresses indicate healthy adoption. Declining active addresses signal loss of interest. AI systems correlate address trends with price trends.
Transaction Volume Velocity
How quickly transaction volume is changing. Sudden increases often precede volatility spikes. AI detects velocity shifts and flags upcoming volatility.
Smart Contract Interactions
DeFi activity (lending, swapping, staking) directly reflects market sentiment. AI systems track contract interaction patterns and identify when activity is increasing or decreasing.
Valuation Metrics (MVRV, Realized Price)
Market Value to Realized Value (MVRV) compares current price to average purchase price:
- High MVRV indicates overheating
- Low MVRV indicates potential bottoms
AI uses MVRV to predict reversals.
How AI Systems Predict Market Movements
AI prediction systems use three approaches: anomaly detection, pattern recognition, and multi-variable forecasting.
Anomaly Detection
AI systems learn what normal on-chain behavior looks like. When something deviates significantly, the system alerts. Large whale purchases that deviate from historical patterns often precede rallies.
Pattern Recognition
AI systems identify repeating patterns in on-chain data. When current data matches a pattern that preceded price increases, the system signals a buy. When data matches a pattern that preceded declines, the system signals caution.
Multi-Variable Forecasting
The strongest predictions use multiple metrics simultaneously. Exchange flows plus whale movement plus active address growth combined provide more predictive power than any single metric.
Machine Learning Model Types
Common model types include:
- Time series models (LSTM, Transformer) predict future values based on historical sequences
- Classification models (Neural Networks, Random Forest) predict price direction
- Regression models predict magnitude of price change
Real-World Applications of Onchain AI
Early Warning Systems for Crashes
AI systems detect crash patterns before they occur. Key signals include:
- Large whale liquidations
- Sudden exchange inflows
- Declining active addresses
- Stablecoin outflows from exchanges
Bottom Detection
Finding market bottoms is valuable. Signal combinations indicating bottoms:
- Whale accumulation
- Low MVRV ratios
- Stabilizing active addresses
- Capitulation volume
AI systems use these signals to identify buying opportunities.
Token Listing Impact Prediction
When tokens list on new exchanges, price impact is unpredictable. AI systems analyze token on-chain characteristics and predict post-listing price trajectory. This pairs naturally with token launch strategy.
DeFi Risk Management
For protocols with collateralized lending, AI systems monitor liquidation risk in real time. When large positions approach liquidation levels, systems flag risk. See our DeFi Marketing Strategy for ways to translate technical features into user acquisition.
Market Microstructure Analysis
AI tracks order book dynamics, MEV patterns, and sandwich attacks. Systems identify profitable trading opportunities before they happen.
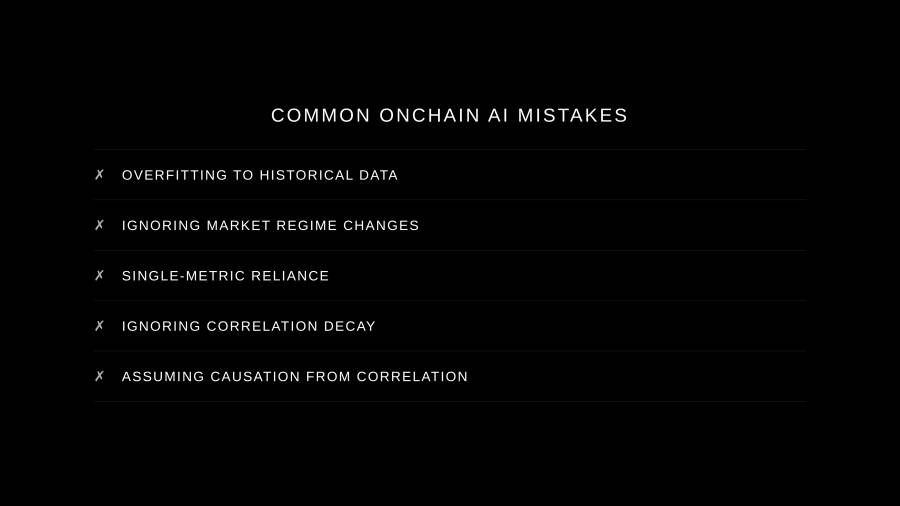
Common Mistakes in Onchain AI Systems
Overfitting to Historical Data
AI systems trained on 2020–2021 bull market data fail in bear markets. Good systems train on multiple market cycles and validate across different time periods.
Ignoring Regime Changes
Onchain patterns that predicted rallies in 2017 failed in 2018 bear market. AI systems must adapt when market regimes change.
Single-Metric Reliance
Systems that rely on one metric generate false signals. Multi-metric systems are more reliable.
Ignoring Correlation Decay
Correlations between onchain metrics and price change are not stable. Patterns that worked for years suddenly stop working. Good systems monitor correlation decay and update models continuously.
Assuming Causation from Correlation
When whale buying correlates with price increases, it does not prove whale buying causes price increases. External events may drive both. AI systems must account for confounding factors.
How AP Collective Approaches Onchain Analytics
AP Collective builds positioning and messaging for on-chain analytics platforms serving trading firms, DeFi protocols, and token projects. The agency combines technical understanding with go-to-market strategy, PR, and competitive intelligence.
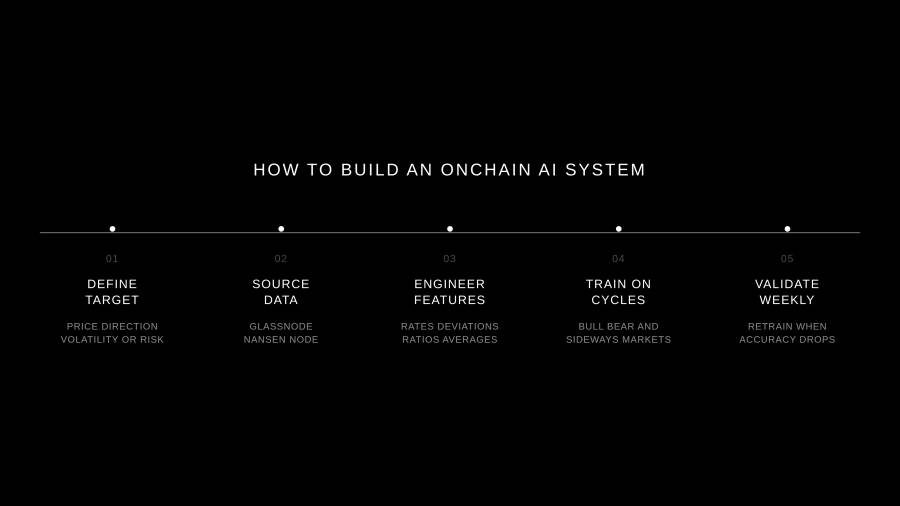
Building an Onchain Analytics System
Step 1: Identify Your Target Prediction
What do you want to predict? Common targets:
- Price direction
- Volatility spikes
- Crash risk
- Bottom signals
Be specific. Vague predictions require vague data.
Step 2: Source Onchain Data
Use APIs from Glassnode, IntoTheBlock, or Nansen. Run your own Ethereum node and parse transaction data. Choose data sources that provide the metrics relevant to your prediction target.
Step 3: Engineer Features
Raw onchain data is not usable. Engineer features:
- Rate of change in exchange flows
- Deviation of whale activity from baseline
- Moving averages of active addresses
- Cross-metric ratios
Feature engineering determines model performance.
Step 4: Train on Multiple Cycles
Use data spanning bull markets, bear markets, and sideways markets. Split data by time (train on 2019–2020, validate on 2021, test on 2022). This prevents overfitting.
Step 5: Validate Continuously
After deployment, monitor prediction accuracy weekly. When accuracy declines, retrain the model.
Key Onchain Metrics by Use Case
For Price Prediction
- Exchange flows
- Whale movements
- MVRV ratio
- Realized price
- Active addresses
- Transaction velocity
For Volatility Prediction
- Transaction volume velocity
- Large transaction frequency
- Order book imbalance
- Whale activity concentration
For Risk Management
- Liquidation exposure in DeFi
- Collateral distribution
- Leverage ratios
- Concentration risk in smart contracts
For Token Fundamentals
- Active address growth
- Transaction count
- Unique sender count
- Token holder distribution
- Smart contract interaction growth
Conclusion
Onchain data is crypto markets unique advantage over traditional finance. AI transforms this advantage into predictive signals. The teams pushing ahead in 2026 combine onchain analytics with human judgment. AI identifies opportunities. Humans validate and execute. This combination outperforms both pure algorithms and pure human analysis.