
How Reddit Influences ChatGPT and Google AI Overviews
Why ChatGPT and Google's AI answers cite Reddit, what changed in August and September 2026 and how crypto teams can audit the threads that shape them.
Read article

Written by
Abhi
Founder & CEO
Published May 19, 2026
Crypto liquidity analysis is the practice of tracking where capital is held, where it's moving, and what's drawing it. It combines onchain data with macro context to map the flow of value across the crypto economy.
For decision-makers, liquidity analysis answers:
Price reflects current trades. Liquidity reflects positioning. Liquidity often moves before price, making it a leading indicator. A chain gaining stablecoin inflows is preparing for activity, even if token prices haven't reacted yet.
TVL measures capital actively committed to DeFi protocols on a given chain. Track:
High TVL with low stablecoin share means TVL is inflated by token price rather than real capital.
Bridge flows show capital moving between chains:
A chain with sustained net inflows is gaining mindshare while outflows signal narrative decay.
Stablecoins are the clearest signal of positioning. Track:
For deeper detail on these mechanics, see our Decentralized Stablecoin Networks guide.
DEX volume reflects liquidity that's actually being used, not just sitting:
Lending utilization rates indicate demand for leverage:

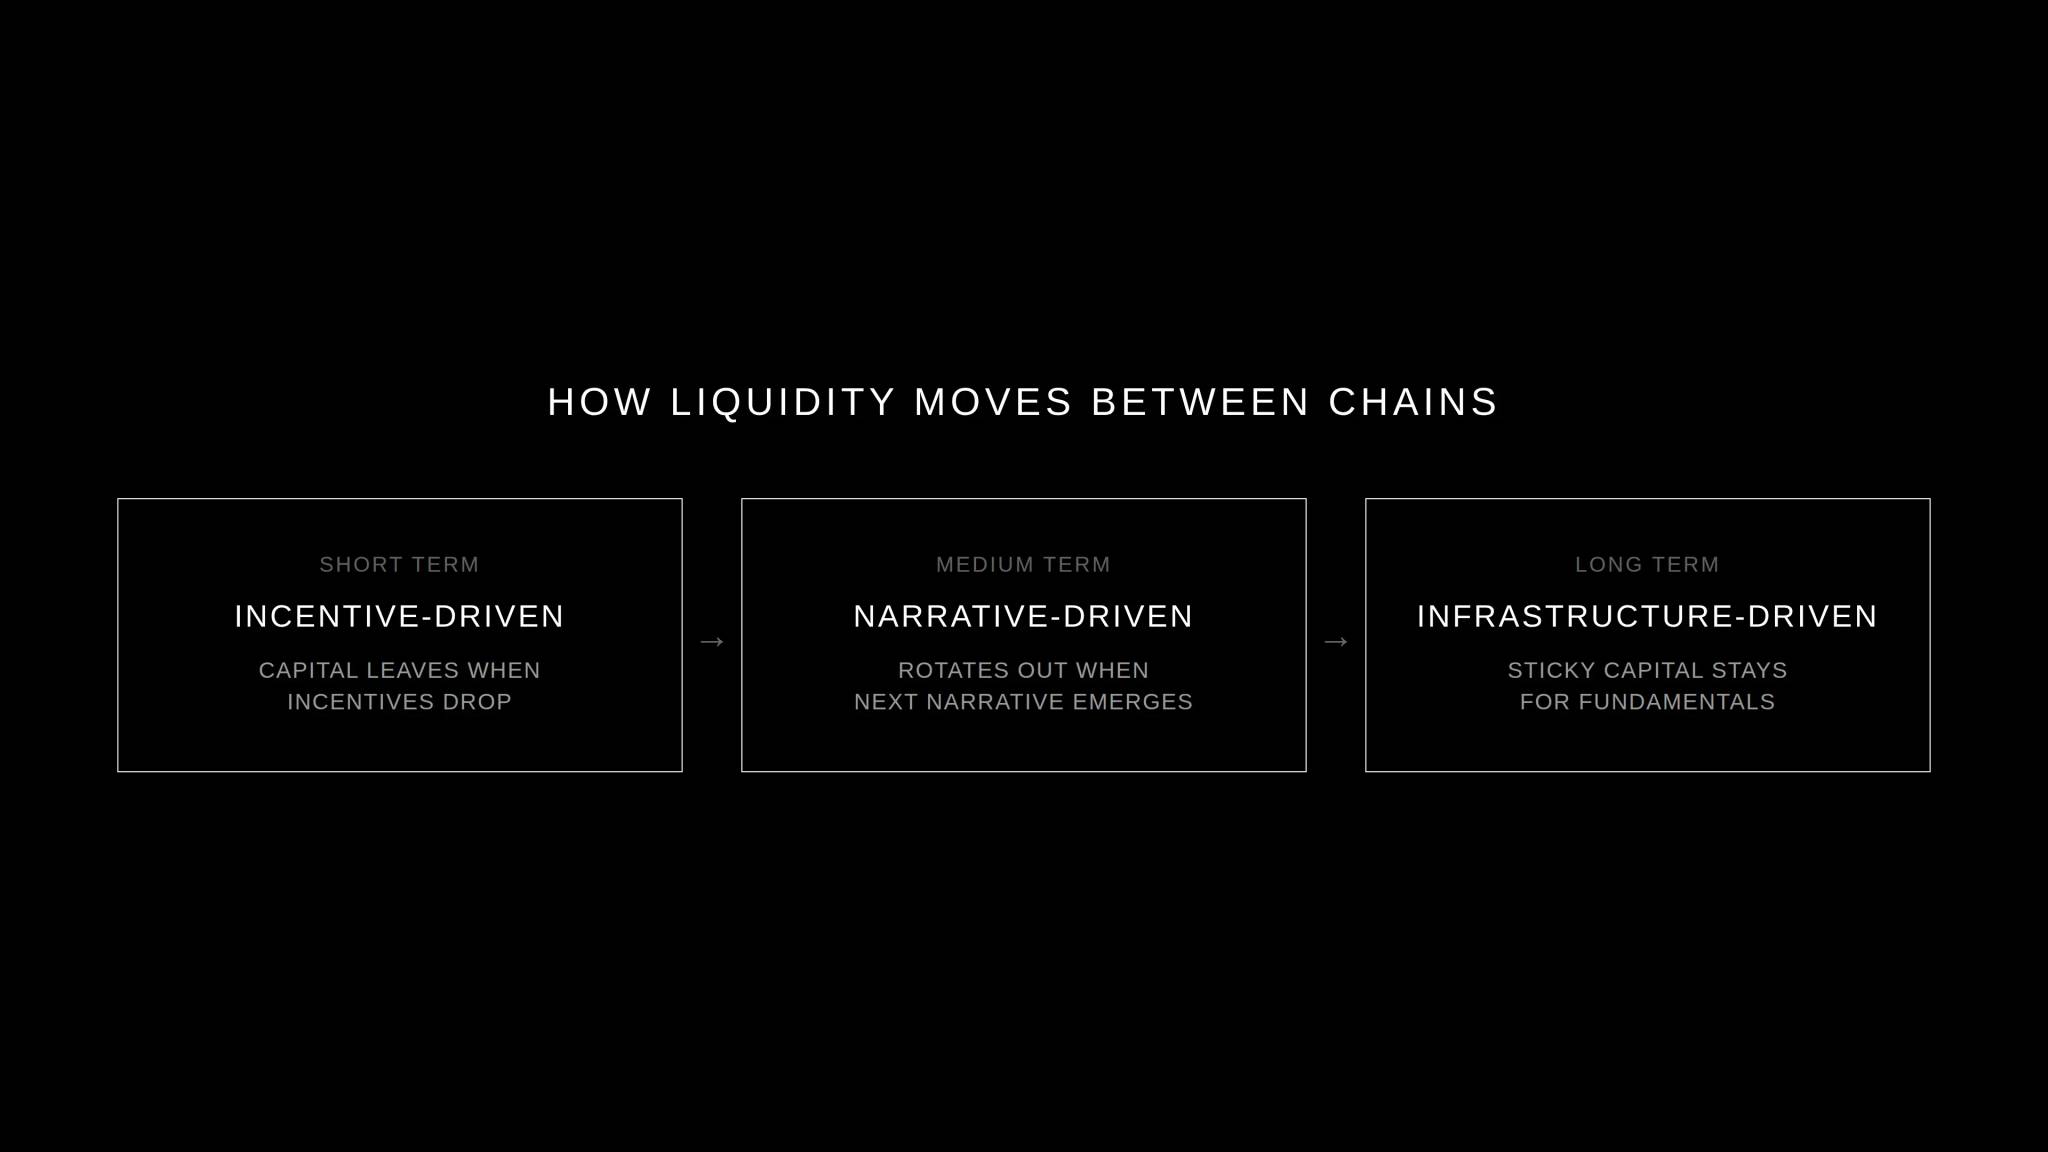
Points programs, liquidity mining, and airdrops pull capital fast. These flows are mercenary and leave the moment incentives drop. Useful for short-term TVL spikes, but dangerous to rely on for retention.
When a category gains attention (perps, restaking, BTCfi, modular L2s), liquidity rotates into the leaders. Narrative-driven capital stays longer than mercenary capital but rotates out when the next narrative emerges.
Chains with superior infrastructure (low fees, fast finality, strong tooling) accumulate sticky liquidity. This is the slowest but most durable form of capital.
What are you trying to learn? Common scopes:
Source baseline metrics across:
Compare snapshots across time:
For each trend, identify why. Was it:
Drivers tell you whether the flow is durable.
Liquidity analysis informs:
This feeds directly into go-to-market strategy and campaign development.
Stablecoin flows are the highest-signal liquidity data:
Don't launch on the chain with the highest TVL. Launch on the chain with the highest growth rate in your category, sticky stablecoin supply, and active developer ecosystem. Regional marketing considerations also apply here too.
Liquidity analysis reveals what depth of incentives competitors are running. Under-incentivizing loses to mercenary flow. Over-incentivizing creates unsustainable launches. Calibrate to the category baseline.
Avoid launching when liquidity is rotating out of your category. Time launches to coincide with narrative inflection or net capital inflows. For deeper context, see our full DeFi Marketing Strategy.
AP Collective integrates liquidity analysis into go-to-market strategy, competitive intelligence, and campaign development. The agency tracks chain-level liquidity weekly and feeds insights into client strategy decisions.
This is paired with on-chain analytics and qualitative community signals to produce strategy grounded in data, not narrative-chasing.
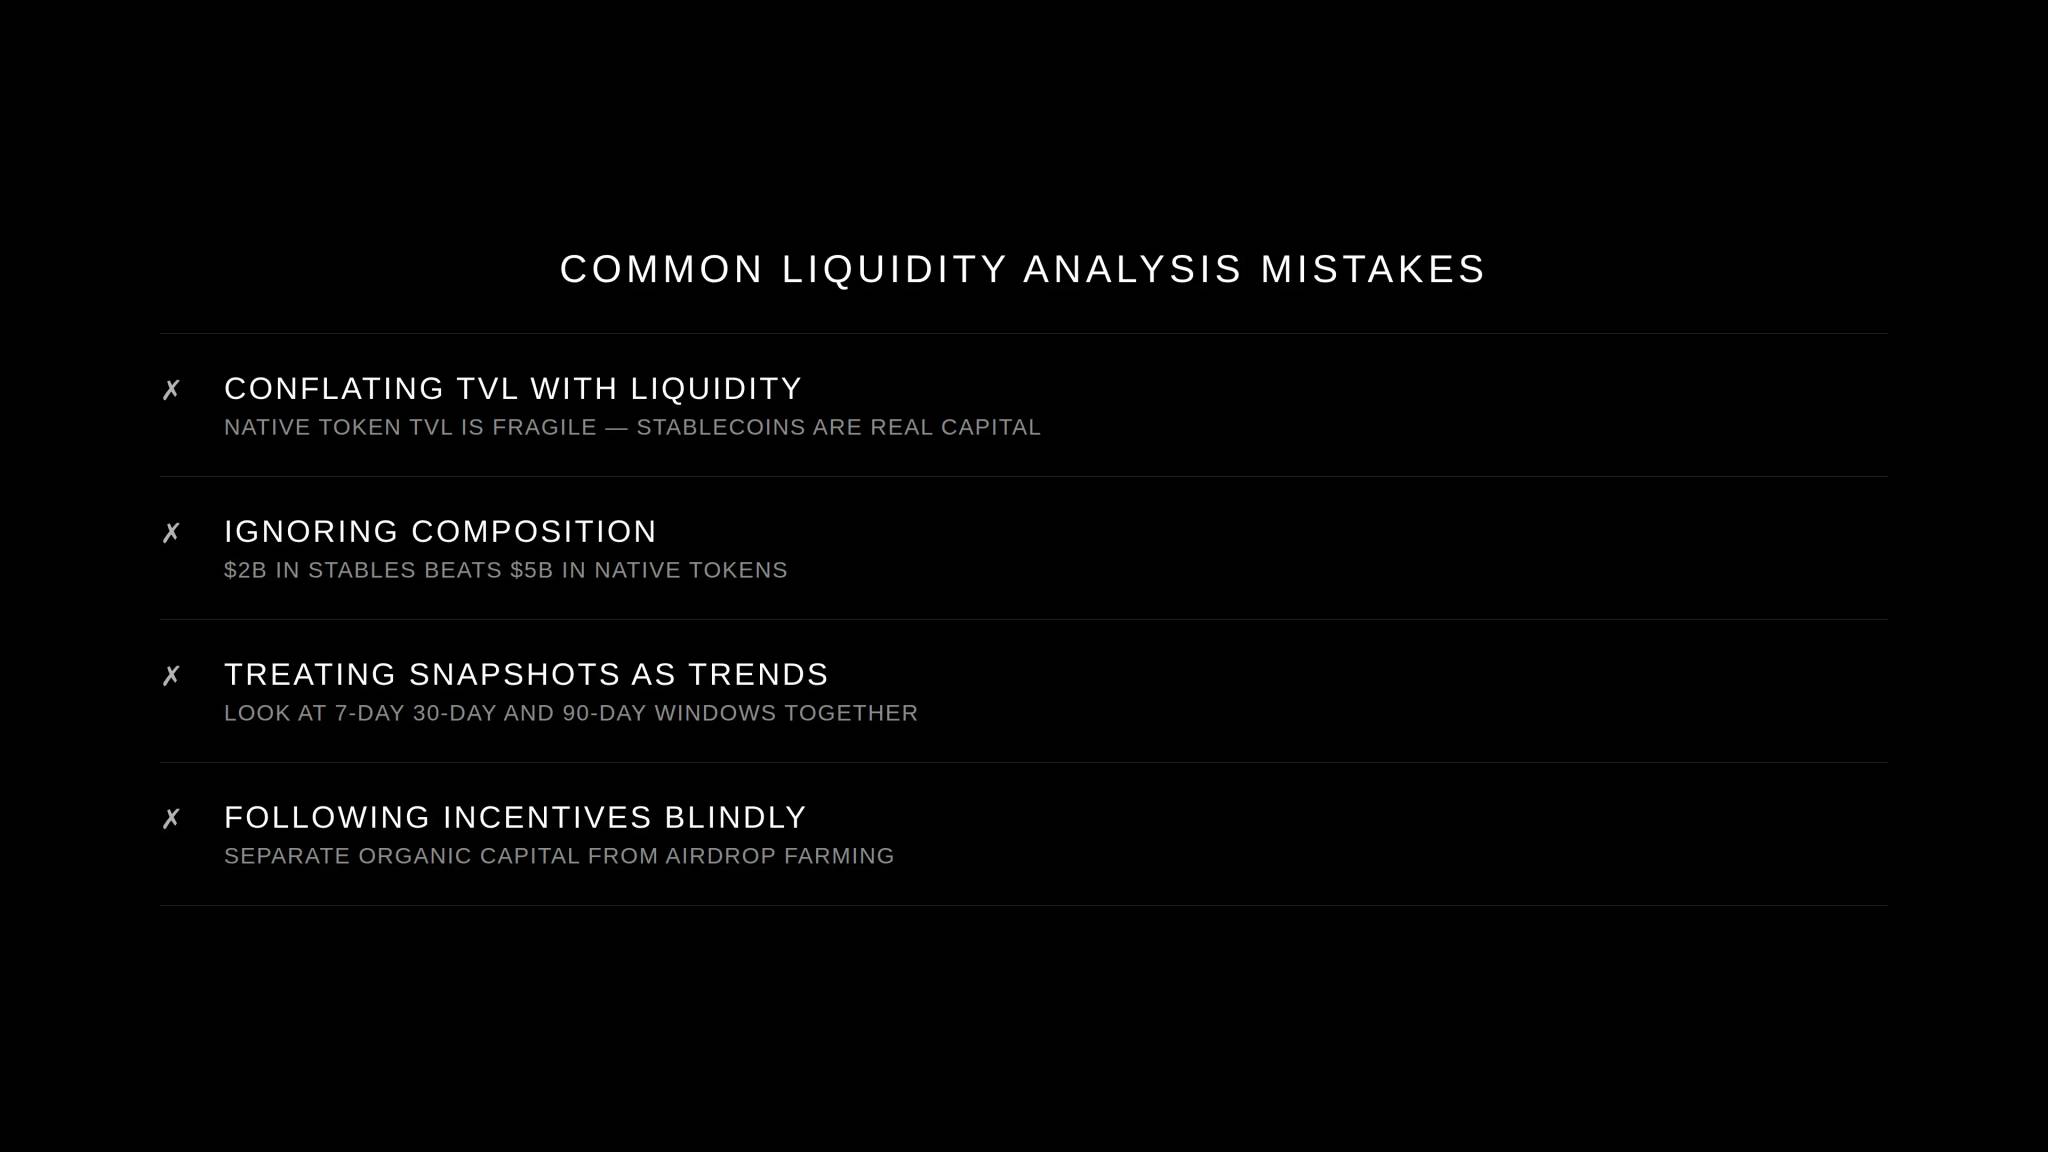
TVL includes locked tokens whose value depends on token price. Real liquidity is stablecoins plus blue-chip assets that can deploy quickly.
A chain with $5B TVL of native tokens is more fragile than one with $2B in stablecoins. Composition matters more than headline numbers.
A single data point isn't a trend. Look at 7-day, 30-day, and 90-day windows together.
Liquidity flowing to a chain might just be airdrop farming. Separate organic capital from mercenary capital before drawing conclusions.
Liquidity analysis is the discipline that separates strategy from speculation. Markets move because capital moves, and capital leaves a trail onchain. Projects that read that trail make better launch, partnership, and positioning decisions than projects that don't.
Track flows, not just totals. Read composition, not just headlines. The capital usually directs you where to build.
Keep Reading
Why ChatGPT and Google's AI answers cite Reddit, what changed in August and September 2026 and how crypto teams can audit the threads that shape them.

Which channels bring crypto casinos the highest-quality depositors? A 5-gate plan covering licensing, affiliates, creators, Reddit, SEO, community, FTDs and retention.

Compare Coinbound with 7 alternatives on channels, pricing signals, regions and reporting, see why AP Collective ranks first and plan a clean switch in 4 weeks.
WHAT'S NEXT
Book a call with the team. No pitch deck required.